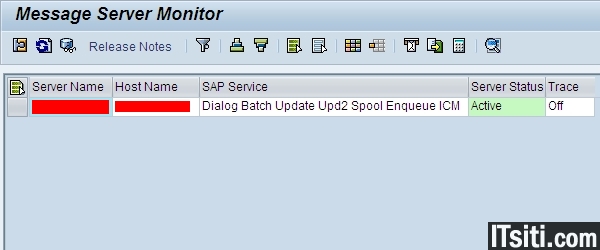
SMMS: SAP Message Server Monitor
You can use the message server monitor to closely monitor the functioning of the message server. The initial screen is identical to the SAP Application Server Overview (SM51). All SAP servers that have logged on to the message server are displayed. To monitor the message server, you can use the Message Server Monitor (transaction SMMS) in the SAP System. You can check and change all the important settings, create and view traces, read statistics, and so on.

Prerequisites
You are logged onto the SAP system, and the message server is running.
Features
The menu option Goto contains all of the functions of the message server monitor.
Display Details
To view detailed information about the client on which the cursor is positioned, choose Goto > Display details.
Information about the Release
To view detailed information about the release of the message server, choose Goto > Release Notes. The release notes provide information on the version of the SAP Message Server, and on the release and Support Package level of the SAP kernel. Kernel information tells you the release of the SAP kernel. Besides kernel release and compile information, this screen provides the following information:
• Update level specifies with which kernel releases the kernel can run in an SAP System. If different application servers are to run with different kernel patch levels in one system, they must all have the same update level.
• Patch number specifies the last Support Package level that is relevant for the component message server.
• Source ID indicates the actual kernel patch level (the number after the full stop).
• Patch number specifies the last Support Package level that is relevant for the component message server.
• Source ID indicates the actual kernel patch level (the number after the full stop).
Hardware Key
You can display the hardware key of your SAP system, which you need to install the SAP license, by choosing Goto > Hardware Keys.
Parameters
You can view all the parameters associated with the Message server by choosing Goto > Parameters > Display. Some of these parameters can be changed dynamically while the system is running; to do this, choose Goto > Parameter > Change. You can display the RZ11 documentation for every parameter. To do this, place your cursor on the parameter name and choose Documentation.
Statistics
You can activate, display, deactivate, or reset Message server statistics. To do this, choose Goto > Statistics. The statistics include information on, among other things, the number of logins, requests received, bytes written and read.
Trace
You can access the following functions of the message server trace by choosing Goto > Trace:
• Display trace file (dev_ms)
• Reset trace file
• Increase or decrease trace level
• Reset trace file
• Increase or decrease trace level
Services
To display the open ports on the message server choose Goto > Services. On these ports you can access the message server, if you want to Monitor the Message Server from the Browser.
Logon Data
You can display the logon data for the individual SAP application servers that are currently logged on to the message server. To do so, select a server and choose Goto > Logon data > Display.
The number of dialog work processes (in the dialog mode) that the message server needs for load distribution is displayed under Additional data. The relevant dispatcher sends this data to the message server when the server is started.
The number of dialog work processes (in the dialog mode) that the message server needs for load distribution is displayed under Additional data. The relevant dispatcher sends this data to the message server when the server is started.
Expert Functions
These functions are required for analysis performed by SAP, and are not described further here. Exceptions to this are the server functions Shut Down Server (Hard), Shut Down Server (Soft,) Terminate connection, Deactivate and Activate. These functions control the state of the application server.
My Reference:
No comments:
Post a Comment